amibroker

HomeKnowledge Base

How to detect the divergences

There are many different ways to check for divergences. One of the simplest is to use Rate of change indicator and EXPLORATION feature of Automatic Analysis window:

– Analysis -> Formula Editor
– enter:
 
// 5 day rate of change of close
PriceUp ROCC) > ;
// 5 day rate of change of MACD histogram
MacdUP ROCMACD() - Signal(), ) > 0;
BullishDiv NOT PriceUP AND MACDUp;
BearishDiv PriceUP AND NOT MACDUp;
Filter BullishDiv OR BearishDiv;
AddColumnBullishDiv"Bullish Divergence"1.0,
       
colorDefaultIIf(BullishDivcolorGreencolorDefault ) ); 
AddColumn
BearishDiv "Bearish Divergence"1.0,
       
colorDefaultIIf(BearishDiv colorRedcolorDefault) )

– Tools -> Send to Auto-analysis
– Apply to: All Symbols, N last quotations = 1
– press EXPLORE

Tools -> Send to Auto-analysis- Apply to: All Symbols, N last quotations = 1- press EXPLORE

A different approach can use linear regression instead:
 
// 10 day linear regression slope of close
PriceUp LinRegSlopeC10 ) > ;
// 10 day linear regression slope of MACD histogram
MacdUP LinRegSlopeMACD() - Signal(), 10 ); 


How to detect the study crossover for multiple symbols with use of SCAN

It’s possible to use Automatic Analysis window to search for trendline (or other study) crossovers for multiple symbols at once. It’s necessary to do the following:

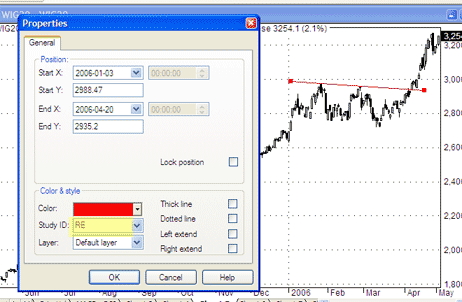
1. Draw trendlines on the chart and assidn them a STUDY ID – two letter code that allows to recognise the particular study. To do this, go to study properties (Alt+Enter) after you draw the line (in this example – StudyID = “RE”).

study1.gif

2. Repeat the process for other symbols (remember to draw the trendlines in the same chart pane).

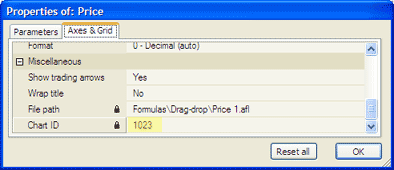
3. Check the CHART ID (in order to call this particular chart pane from the SCAN). To check the ChartID – click on the chart with right mouse button, go to: PARAMETERS -> Axes&Grid (in this example – CHARTID = 1023).

study2.gif

4. Now we can write the formula:
– Analysis -> Formula Editor
– enter:

Buy = Cross( Close, Study(“RE”, 1023) );

(note that we use the same StudyID and ChartID in the formula)
– Tools -> Send to analysis.
– Apply To: All Symbols, All Quotations
– press SCAN

New keywords in AFL and possible conflict with user-defined variables

AmiBroker 4.91.0 BETA introduced the following new keywords:

switch, case, break, continue, default

You have to make sure that your formulas do not use them as variable names. The above words are now reserved AFL keywords and if you use them for your own variables you need to replace this identifiers with names that do not conflict with the reserved keywords.

This article shows how to perform multiple-file text replace very quickly. (more…)

How to chart spreads?

To create a spread chart (and other multi-security indicators / statistics etc.) one can use FOREIGN function which allows to refer to other symbols than currently selected:

It’s necessary to do the following:
– Analysis -> Formula Editor
– enter the formula:


spread Foreign"ticker1""C") - Foreign"ticker2""C");
Plotspread"spread"colorRed); 

– Tools -> Apply Indicator
(replace ticker1, ticker2 with actual symbol names)

How to plot a trailing stop in the Price chart

In this short article we will show how to calculate and plot trailing stop using two different methods. (more…)

How to fill the area between two lines with a solid color

This example shows how to fill the area between Bollinger Bands with a solid color. (more…)

Calendar day index

Someone asked me recently how to count calendar days (not bars) that passed since first available quote. AmiBroker has a built-in function ( since version 5.20 ) that calculates the number of days that passed since January 1st, 1900. This function can be used to easily implement number of days since first available quote Here is a sample formula that shows how to do that. (more…)

How to close open positions at the end of the day (for daytraders)

If we are backtesting the intraday strategy and we do not want to keep open positions overnight – then it’s necessary to force closing all the open positions before the session end. In order to code it in AFL – the easiest is to use TimeNum() function for that purpose. (more…)

How to set individual trading rules for symbols in the same backtest

The following code shows how to use separate trading rules for several symbols included in the same backtest. (more…)

Stops priority in the default backtest procedure in AmiBroker

The order stops are triggered in the backtest is the following:
 – Fixed Ruin stop (loosing 99.96% of the starting capital)
 – Max. loss stop
 – Profit target stop
 – Trailing stop
 – N-bar stop* (see below)

In versions 4.61 and higher: you can decide if N-BAR stop has the lowest or the highest priority. (more…)

« Previous PageNext Page »