amibroker

HomeKnowledge Base

Historical portfolio backtest metrics

Recently on the AmiBroker mailing list some users expressed wish to have access to some of portfolio backtest metrics available in “historical” form (i.e. as date series, as opposed to scalars), so they can be plotted as an indicator.

Implementing such functionality is actually easy with existing tools and does not require any OLE scripts. Everything you need is small custom-backtester procedure that just reads built-in stats every bar and puts them into composite ticker.
In the accompanying indicator code all you need to do is simply use Foreign() function to access the historical metrics data generated during backtest.

The code below shows the BACKTEST formula with custom backtester part:

// Replace lines below with YOUR TRADING SYSTEM
EnableRotationalTrading();
PositionScore 1/RSI(14);
PositionSize = -25;
SetOption("WorstRankHeld");
SetOption("MaxOpenPositions"); 

////////////////////////////////////////
// BELOW IS ACTUAL CUSTOM BACKTESTER PART
// that can read any built-in metric (in this example UlcerIndex)
// and store it into composite ticker for further
// retrieval as data series

SetOption("UseCustomBacktestProc"True ); 

if( 
Status("action") == actionPortfolio )
{
  
bo GetBacktesterObject();

  
bo.PreProcess(); // Initialize backtester

  // initialize with null
  // you can have as many historical metrics as you want
  // (just duplicate line below for many metrics you want)
  
MyHistStat1 Null;
  
MyHistStat2 Null// add your own 

  
for(bar=0bar BarCountbar++)
  {
   
bo.ProcessTradeSignalsbar );
  
   
// recalculate built-in stats on EACH BAR
   
stats bo.GetPerformanceStats); 
 
   
// the line below reads the metric and stores it as array element
   // you can add many lines for each metric of your choice
   
MyHistStat1bar ] = stats.GetValue("UlcerIndex"); // get ulcer index value calculated this bar
   
MyHistStat2bar ] = stats.GetValue("WinnersPercent"); // add your own

  
}

  
bo.PostProcess(); // Finalize backtester

  // now STORE the historical data series representing the metric of your choice
  // duplicate the line below for as many metrics as you want
  
AddToCompositeMyHistStat1"~~~UI_HISTORICAL""X"atcFlagEnableInPortfolio atcFlagDefaults );

  
// you can add your own as shown below
  
AddToCompositeMyHistStat2"~~~WP_HISTORICAL""X"atcFlagEnableInPortfolio atcFlagDefaults ); 

In the code above, for illustration purposes, we are exporting UlcerIndex and Winners Percent metrics as data series. They are stored in composite tickers for easy retrieval from indicator level.
You can easily extend code to include ANY number of metrics you want.

Now in order to Plot metrics as indicators, use this simple formula:

PlotForeign("~~~UI_HISTORICAL""UlcerIndex Historical"colorRedstyleLine );
PlotForeign("~~~WP_HISTORICAL""Winners Percent"colorBluestyleLine styleOwnScale )

As you can see with one Foreign function call you can read the historical value of any metric generated by the backtester.

NOTE: when running backtest please setup a filter in AA that EXCLUDES composites (group 253) from backtest set.

Big symbol text in the background

Recently I heard the suggestion to add a security symbol written in big letters in the chart background. Well, actually it is pretty simple to do using low-level gfx. Just add this code sniplet anywhere in your chart formula.

GfxSetOverlayMode(1);
GfxSelectFont("Tahoma"Status("pxheight")/);
GfxSetTextAlign);// center alignment
GfxSetTextColorColorRGB200200200 ) );
GfxSetBkMode(1); // transparent
GfxTextOutName(), Status("pxwidth")/2Status("pxheight")/12 )

UPDATE: I have added transparent mode, so it works fine on non-white backgrounds too.

Getting started with automatic Walk-Forward optimization

Recently released AmiBroker 5.05 BETA features the automatic Walk-Forward Optimization mode.

The automatic Walk forward optimization is a system design and validation technique in which you optimize the parameter values on a past segment of market data (“in-sample”), then test the system forward in time on data following the optimization segment (“out-of-sample”). You evaluate the system based on how well it performs on the test data (“out-of-sample”), not the data it was optimized on.

To use Walk-Forward optimization please follow these steps:

  1. Goto Tools->Automatic Analysis
  2. Click Settings button, then switch to “Walk-Forward tab”
  3. Here you can see Walk forward settings for In-sample optimization, out-of-sample backtest
    “Start” and “End” dates mark initial period begin / end
    This period will be moved forward by “Step” until the “End” reaches the “Last” date.
    The “Start” date can move forward by “step” too, or can be anchored (constant) if “Anchored” check is on.
    If you mark “Use today” then “Last” date entered will be ignored and TODAY (current date) will be used instead

    By default an “EASY MODE” is selected which simplifies the process of setting up WF parameters.
    It assumes that:
    a) Out-of-sample segment immediatelly follows in-sample segment
    b) the length of out-of-sample segment equals to the walk-forward step

    Based on these two assumptions the “EASY” mode takes in-sample END date and sets
    out-of-sample START date to the following day. Then adds in-sample STEP and this becomes out-of-sample END date.
    In-sample and Out-of-sample step values are set to the same values.

    The “EASY” mode guarantees correctness of WF procedure settings.

    In the “ADVANCED” mode, the user has complete control over all values, to the extent that
    they may not constitute valid WF procedure.
    The interface allows to selectivelly disable in-sample and out-of-sample phases using checkboxes at top
    (for special things like runnign sequential backtests without optimization).

    All settings are immediatelly reflected in the PREVIEW list that shows all generated IS/OOS segments and their dates.

    The “Optimization target” field defines the optimization raport COLUMN NAME that
    will be used for sorting results and finding the BEST one. Any built-in column can be used
    (as appears in the optimization output), or you can use any custom metric that you define
    in custom backtester. The default is CAR/MDD, you can however select any other built-in metric from the combo.
    You can also TYPE-IN any custom metric that you have added via custom backtester interface.

  4. Once you defined Walk-Forward settings, please go to Automatic Analysis and
  5. press the dropdown ARROW on the Optimize button and select “Walk Forward Optimization”

This will run sequence of optimizaitons and backtest and the results will be displayed in the “Walk Forward” document that is open in the main application frame.
When optimization is running you can click “MINIMIZE” button on the Progress dialog to minimize it – this allows to see the Walk Forward output during the optimization steps.

IN-SAMPLE and OUT-OF-SAMPLE combined equity

Combined in-sample and out-sample equities are available by
~~~ISEQUITY and ~~~OSEQUITY composite tickers (consecutive periods of IS and OOS are concatenated and scaled to
maintain continuity of equity line – this approach assumes that you generally speaking are compounding profits)
To display IS and OOS equity you may use for example this:

PlotForeign("~~~ISEQUITY","In-Sample Equity"colorRedstyleLine);
PlotForeign("~~~OSEQUITY","Out-Of-Sample Equity"colorGreenstyleLine);
Title "{{NAME}} - {{INTERVAL}} {{DATE}} {{VALUES}}"

Low-level gfx example: Yearly/monthly profit chart

The code below is an little bit more complex example of Low Level Graphics functions (see http://www.amibroker.com/guide/a_lowlevelgfx.html)

It allows to display three kinds of charts:

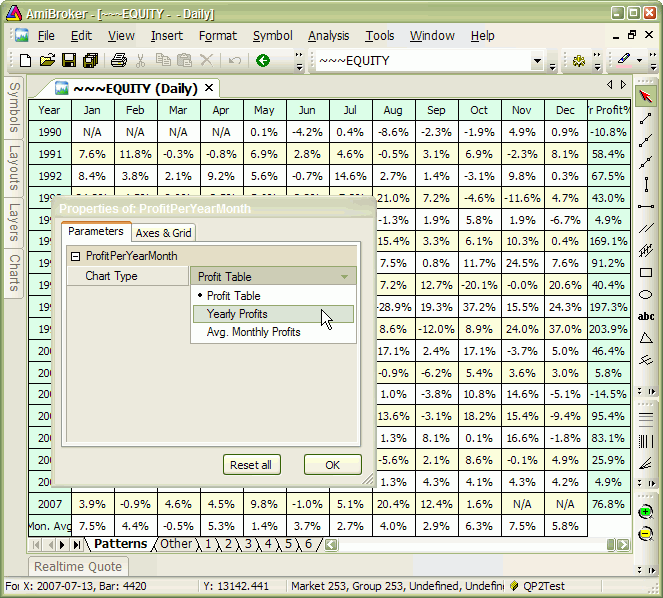
  1. yearly/monthly profit table
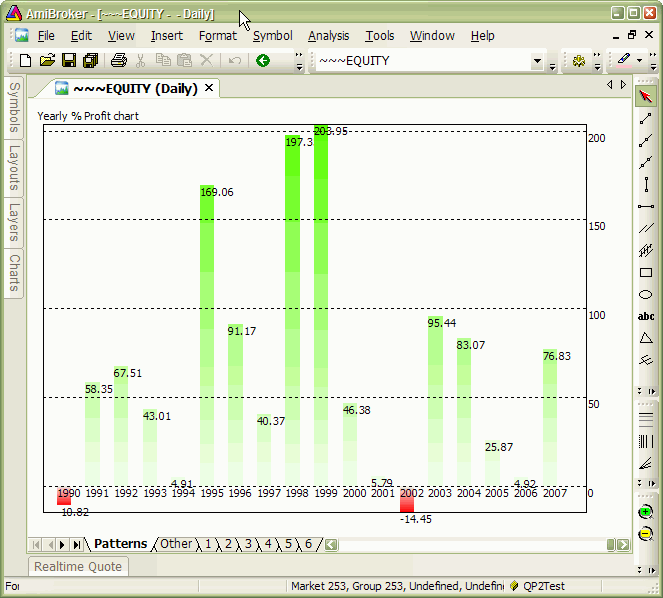
  2. yearly profit bar chart
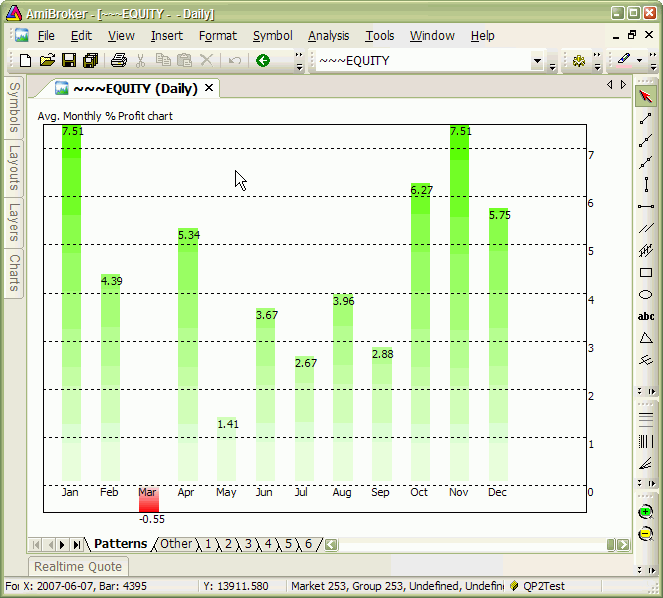
  3. average monthly profit bar chart

The type of chart is switchable from Parameters dialog.

It should be applied to ~~~EQUITY – portfolio equity symbol (so it only produces output if you run backtest before using it).


SetBarsRequired(1000000,1000000);
eq Foreign("~~~EQUITY""C" );

yr Year();
mo Month();

YearChange yr != Refyr, -);
MonChange mo != Refmo, -);

FirstYr 0;
LastYr 0;

startbar 0;

////////////////////////////
// SKIP non-trading bars
////////////////////////////
for( 0BarCounti++ )
{
  if( 
eq] )
  {
    
startbar i;
    break;
  } 
}

////////////////////////////
// collect yearly / monthly changes in equity
// into dynamic variables
////////////////////////////

LastYrValue eqstartbar  ];
LastMoValue eqstartbar  ];

MaxYrProfit MinYrProfit 0;
MaxMoProfit MinMoProfit 0;

for( 
startbar 1BarCounti++ )
{
  if( 
YearChange] || == BarCount )
  {
    
Chg 100 * ( -eq] / LastYrValue );
    
VarSet("ChgYear"yr], Chg );

    
MaxYrProfit MaxMaxYrProfitChg );
    
MinYrProfit MinMinYrProfitChg );

    if( 
FirstYr == FirstYr yr];
    
LastYr yr];

    
LastYrValue eq];
  }

  if( 
MonChange ] || == BarCount )
  {
    
mon mo];

    
Chg 100 * ( -eq] / LastMoValue );

    
VarSet("ChgMon" yr] + "-" monChg );
    
VarSet("SumChgMon"monChg NzVarGet("SumChgMon"mon ) ) );
    
VarSet("SumMon" monNzVarGet("SumMon"mon ) ) );
 
    
MaxMoProfit MaxMaxMoProfitChg );
    
MinMoProfit MinMinMoProfitChg );

    
LastMoValue eq];
  }
}

/////////////////////////////////////////////////
// Drawing code & helper functions
////////////////////////////////////////////////

GfxSetOverlayMode);

CellHeight = (Status("pxheight")-1)/(LastYr FirstYr ); 
CellWidth = (Status("pxwidth")-1)/14
GfxSelectFont"Tahoma"8.5 ); 

GfxSetBkMode);

function 
PrintInCellstringrowCol 
{
 
Color =  ColorRGBIIfrow == || col == || col == 13220255 ), 255IIfrow 2255220 ) );
 
GfxSelectSolidBrushColor   );
 
GfxRectangleCol CellWidth
                    
row CellHeight, (Col ) * CellWidth 1
                    (
row ) * CellHeight  1); 
 
GfxDrawTextstringCol CellWidth 1
                    
row CellHeight 1
                    (
Col ) * CellWidth, (row ) * CellHeight32+); 


YOffset 25;
XOffset 15;

function 
DrawBartextbarnumbarsyMinyMaxy )
{
 
BarWidth = (Status("pxwidth") - XOffset )/( numbars ); 
 
BarHeight Status("pxheight") - YOffset;
 
relpos = ( Miny ) / (Maxy Miny );

 
xp XOffset + ( bar 0.5 ) * BarWidth;
 
yp YOffset BarHeight * ( relpos );
 
xe XOffset + ( bar ) * BarWidth;
 
ye YOffset BarHeight * ( - ( -miny )/( maxy miny ) );
  
 if( 
)
 {
 
GfxGradientRectxpyp,
                  
xe ye,
                  
ColorHSB70255 relpos255 ), ColorHSB7020255 ) );
 }
 else
 {
 
GfxGradientRectxpye,
                  
xe yp,
                  
ColorHSB020255 ), ColorHSB0255 * ( relpos ), 255 ) );
 }
 
GfxTextOuttextxpye );
 
GfxTextOutStrFormat("%.2f"), xpyp );
}    

function 
DrawLevelsMinyMaxy )
{
  
range Maxy Miny;

  
grid 100;
  if( 
range 10 grid 1;
  else 
  if( 
range 20 grid 2;
  else 
  if( 
range 50 grid 5;
  else 
  if( 
range 100 grid 10;
  else 
  if( 
range 200 grid 20;
  else 
  if( 
range 500 grid 50;

  
_TRACE("grid = "+grid +" range "+range );
  
  
width Status("pxwidth") - XOffset;
  
height Status("pxheight") - YOffset;

  
GfxSelectPencolorBlack1);
  for( 
grid ceilMiny grid ); <= grid floorMaxy grid ); += grid )
  {
    
yp =  YOffset Height * ( -  ( Miny ) / (Maxy Miny ) );

    
GfxMoveToXOffsetyp );
    
GfxLineToXOffset width yp );
    
GfxTextOut""yXOffset widthyp );
  }

  
GfxSelectPencolorBlack1);
  
GfxMoveToXOffsetYOffset );
  
GfxLineToXOffset widthYOffset );
  
GfxLineToXOffset widthYOffset Height );
  
GfxLineToXOffset YOffset Height );
  
GfxLineToXOffset YOffset );
}

MonthNames "Jan,Feb,Mar,Apr,May,Jun,Jul,Aug,Sep,Oct,Nov,Dec";

function 
DisplayProfitTable( )
{
 
Header "Year,"+MonthNames+",Yr Profit%";
 for( 
Col 0; (Colname StrExtractHeaderCol ) ) != ""Col++ )
 {
  
PrintInCellColName0Col );
 }

 
Row 1;
 for( 
FirstYr<= LastYry++ )
 {
  
PrintInCellStrFormat("%g"), Row); 
  
PrintInCellStrFormat("%.1f%%"VarGet("ChgYear" ) ), Row13 ); 
  for( 
1<= 12m++ )
  { 
   
Chg VarGet("ChgMon" "-" m);
   if( 
Chg 
     
PrintInCellStrFormat("%.1f%%"Chg ), Row);
   else
     
PrintInCell"N/A"Row);
  }
  
Row++;
 } 

 
PrintInCell("Mon. Avg"Row);
 for( 
1<= 12m++ )
 { 
   
PrintInCellStrFormat("%.1f%%",  NzVarGet("SumChgMon" m)/VarGet("SumMon" ) ) ), Row);
 }

}

function 
DisplayYearlyProfits()
{
 
Bar 0;
 for( 
FirstYr<= LastYry++ )
 {
   
Chg VarGet("ChgYear" );
   
DrawBar""+yBar++, ( LastYr FirstYr ), ChgMinYrProfitMaxYrProfit );
 }
 
GfxTextOut("Yearly % Profit chart"1010 );

 
DrawLevelsMinYrProfitMaxYrProfit ); 
}

function 
DisplayMonthlyProfits()
{
 
Bar 0;
 
 
MinAvgProf MaxAvgProf 0;
 for( 
1<= 12y++ )
 {
   
Chg VarGet("SumChgMon" ) / VarGet("SumMon" );
   
MinAvgProf MinMinAvgProfChg );
   
MaxAvgProf MaxMaxAvgProfChg );
 }

 for( 
1<= 12y++ )
 {
   
Chg VarGet("SumChgMon" ) / VarGet("SumMon" );
   
DrawBarStrExtract(MonthNamesy-), Bar++, 13ChgMinAvgProf MaxAvgProf );
 }
 
GfxTextOut("Avg. Monthly % Profit chart"1010 );

 
DrawLevelsMinAvgProf MaxAvgProf ); 
}

///////////////////////////
// This function checks if currently selected symbol
// is portfolio equity
//////////////////////////
function CheckSymbol()
{
 if( 
Name() != "~~~EQUITY" )
 {
  
GfxSelectFont"Tahoma"20 ); 
  
GfxSetBkMode);
  
GfxTextOut("For accurate results switch to ~~~EQUITY symbol"1010 );
 }
}

////////////////////////////
// Main program - chart type switch
////////////////////////////
type ParamList("Chart Type""Profit Table|Yearly Profits|Avg. Monthly Profits");

switch( 
type )
{
 case 
"Profit Table"
         
DisplayProfitTable();  
         break;
 case 
"Yearly Profits"
         
DisplayYearlyProfits();
         break;
 case 
"Avg. Monthly Profits"
         
DisplayMonthlyProfits();
         break;
}

CheckSymbol()

Figure 1. Profit chart in table mode

Profit chart example 2

Figure 2. Profit chart in yearly mode

Profit chart example 3

Figure 3. Profit chart in monthly mode

Profit chart example 4

AmiQuote and free data from Yahoo

There are a couple of things you need to know about Yahoo Finance pages that AmiQuote uses to download “historical” and “current” quotes.

Current quotes are quotes for current day (or previous day if there is no trading session today). For example MSFT current quote page is here:
http://finance.yahoo.com/q?s=MSFT
AmiQuote uses rather “download data” link which is: http://download.finance.yahoo.com/d/quotes.csv?s=MSFT&f=sl1d1t1c1ohgv&e=.csv
But it is not relevant because both show same current quote.

Now there is a second source. Historical quotes are downloaded from Historical Prices page. For example MSFT historical page is here: https://finance.yahoo.com/quote/MSFT/history?p=MSFT (again AmiQuote uses rather plain text link “Download data” (URL is dynamic, so you must click on “Download data” link on Yahoo page)

Why using two sources? That’s simple: current mode gives data during trading session, while historical is only updated many hours after markets close so both compliment each other. Current mode is also much faster as it downloads as many as 200 symbols at once, while historical must download one by one. So recommended usage is to use Yahoo Current mode everyday, and Yahoo Historical once a week.
Of course you may use historical everyday as well if you have time and fast internet connection.

It is important to understand that AmiQuote is just the downloader (like Internet Explorer) and it does nothing except downloading the data, so if you belive that there is a bad quote – it is not AmiQuote, but rather Yahoo problem. To verify always go to relevant page (see links above) and check the quote on Yahoo Finance site directly.

It may happen that quotes on Yahoo Current page and Yahoo Historical pages differ. It is so because Yahoo gets them from different data vendors. If this happens the only solution is to report data error to Yahoo.

There are however 2 things you need to know about importing of data:

  1. AmiBroker by default imports split adjusted data (“Open, High, Low, Close” on Yahoo Historical page). For more information on how data are adjusted see Yahoo Help page at: http://help.yahoo.com/l/us/yahoo/finance/quotes/quote-12.html
  2. You can change it to import split-and-dividend adjusted data (“Adj. Close” on Yahoo Historical Page) as described below

These things are adjustable, so if you don’t like them, you can change them.
The import process of historical quotes is controlled using aqh.format file that you will find inside “Formats” subfolder. By default it looks as follows (you can open it with Windows Notepad).

# AmiQuote historical quotes download format (.AQH extension)
$FORMAT Date_DMY,Open,High,Low,Close,Skip,Volume
$SKIPLINES 0
$BREAKONERR 0
$SEPARATOR ,
$DEBUG 1
$AUTOADD 1
$CONT 1
$GROUP 254

Lines marked with bold mark important areas.

$FORMAT line controls the import format.
Yahoo currently delivers only ADJUSTED data. But they are adjusted in two ways. First way is just adjusting for splits. And these data are downloaded by default.
Additionally Yahoo has “Adj. Close” column that provides close price adjusted for splits AND dividends.
You can download data adjusted for splits AND dividends by changing aqh.format file.
AdjClose field says that AmiBroker should use adjusted price. If you want prices adjusted for both splits and dividends simply replace $FORMAT line with:

$FORMAT Date_DMY,Open,High,Low,Close,AdjClose,Volume
(note AdjClose in place of Skip field)

$VOLFACTOR line controls the volume multiplier. If you want volume to be expressed in single shares instead of hundreds of shares replace $VOLFACTOR line with:

$VOLFACTOR 1

The same $VOLFACTOR change should be applied to aqd.format file that is responsible for importing data in Yahoo CURRENT mode (if you are using it).

How to display the indicators based on Advances/Declines

IMPORTANT: The article below applies ONLY TO LOCAL DATABASES. If you are using ANY plugin-driven database (eSignal, IQFeed, Premium Data, Norgate, Interactive Brokers or whatever other 3rd party plugin), then you SHOULD NOT use “calculate composites” tool. Instead use composite symbols that are provided by data vendor. Contact data vendor to learn what symbols given data vendor uses, because composite symbols are NOT standarized and vary from vendor to vendor

In order to display indicators based on Advances/Declines first of all it’s necessary to calculate composities in the database:

  1. Open Categories window using Symbol->Categories menu item.
  2. Select base index for given market in Markets tab and Base indexes for – Composites combo.
    For example if you are following NYSE this can by ^DIJ (Dow Jones Average)
    (certain symbol must be marked as index in Symbol -> Information and must belong to the same market)

  3. Choose Symbol ->Calculate composites  menu item to open the window shown below and mark:
    – Number of advancing/declining issues and
    – Apply to: all quotes, All markets

  4. Click Calculate . From now on ADLine, AdvVolume() and TRIN indicators will be visible.

Q: Why does AB need “base index”?
A: Just because it may happen that not all stocks are quoted every businness day and AB needs must calculate number of advancing/declining issues per market. So it checks the “base index” quotations dates and tries to find corresponding quotes of all stocks belonging to that market to find out how many issues advanced, declined and not changed at all.

Q: What are “Volume for base index” and “Copy volume to all indexes” checkboxes for?
A: “Volume for base index” and “Copy volume to all indexes” are provided in case you DON’T have real volume data for index quotes. In that case AmiBroker can calculate volume for index as a sum of volumes of all stocks belonging to given market. First option assigns calculated volume only to “base index”, the second copies the volume figure to all indexes belonging to given market.

How to detect the divergences

There are many different ways to check for divergences. One of the simplest is to use Rate of change indicator and EXPLORATION feature of Automatic Analysis window:

– Analysis -> Formula Editor
– enter:
 
// 5 day rate of change of close
PriceUp ROCC) > ;
// 5 day rate of change of MACD histogram
MacdUP ROCMACD() - Signal(), ) > 0;
BullishDiv NOT PriceUP AND MACDUp;
BearishDiv PriceUP AND NOT MACDUp;
Filter BullishDiv OR BearishDiv;
AddColumnBullishDiv"Bullish Divergence"1.0,
       
colorDefaultIIf(BullishDivcolorGreencolorDefault ) ); 
AddColumn
BearishDiv "Bearish Divergence"1.0,
       
colorDefaultIIf(BearishDiv colorRedcolorDefault) )

– Tools -> Send to Auto-analysis
– Apply to: All Symbols, N last quotations = 1
– press EXPLORE

Tools -> Send to Auto-analysis- Apply to: All Symbols, N last quotations = 1- press EXPLORE

A different approach can use linear regression instead:
 
// 10 day linear regression slope of close
PriceUp LinRegSlopeC10 ) > ;
// 10 day linear regression slope of MACD histogram
MacdUP LinRegSlopeMACD() - Signal(), 10 ); 


How to detect the study crossover for multiple symbols with use of SCAN

It’s possible to use Automatic Analysis window to search for trendline (or other study) crossovers for multiple symbols at once. It’s necessary to do the following:

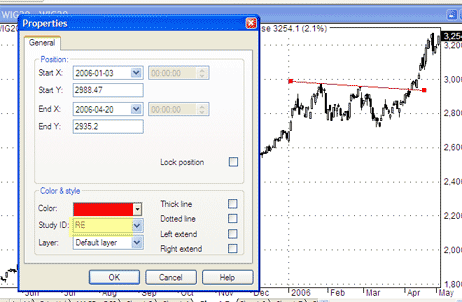
1. Draw trendlines on the chart and assidn them a STUDY ID – two letter code that allows to recognise the particular study. To do this, go to study properties (Alt+Enter) after you draw the line (in this example – StudyID = “RE”).

study1.gif

2. Repeat the process for other symbols (remember to draw the trendlines in the same chart pane).

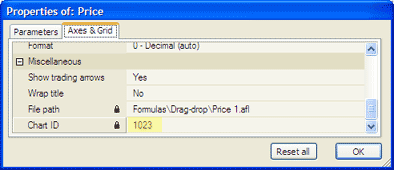
3. Check the CHART ID (in order to call this particular chart pane from the SCAN). To check the ChartID – click on the chart with right mouse button, go to: PARAMETERS -> Axes&Grid (in this example – CHARTID = 1023).

study2.gif

4. Now we can write the formula:
– Analysis -> Formula Editor
– enter:

Buy = Cross( Close, Study(“RE”, 1023) );

(note that we use the same StudyID and ChartID in the formula)
– Tools -> Send to analysis.
– Apply To: All Symbols, All Quotations
– press SCAN

New keywords in AFL and possible conflict with user-defined variables

AmiBroker 4.91.0 BETA introduced the following new keywords:

switch, case, break, continue, default

You have to make sure that your formulas do not use them as variable names. The above words are now reserved AFL keywords and if you use them for your own variables you need to replace this identifiers with names that do not conflict with the reserved keywords.

This article shows how to perform multiple-file text replace very quickly. (more…)

How to chart spreads?

To create a spread chart (and other multi-security indicators / statistics etc.) one can use FOREIGN function which allows to refer to other symbols than currently selected:

It’s necessary to do the following:
– Analysis -> Formula Editor
– enter the formula:


spread Foreign"ticker1""C") - Foreign"ticker2""C");
Plotspread"spread"colorRed); 

– Tools -> Apply Indicator
(replace ticker1, ticker2 with actual symbol names)

« Previous PageNext Page »