amibroker

HomeKnowledge Base

What are constants in AFL and how they work

The AFL language contains many pre-defined words like: shapeUpArrow, stopTypeTrailing, colorRed, styleThick, inDaily and many more. These are examples of constants. As written in AFL language specification (http://www.amibroker.com/guide/a_language.html): Constants are tokens representing fixed numeric or character values.

To better explain what this means, let us consider example of PI constant, which equals 3.14159265358979….. PI is the name of constant we use this name in mathematical equations, because it is easier and more practical to use than using the numerical value each time. Constants in AFL serve the same purpose, each of these words represents certain value properly interpreted by the program in the context they are used.

That is why using the following statement in backtesting code:

ApplyStopstopTypeTrailingstopModePercent10 )

is much better to use than cryptic statement like:

ApplyStop2110 )

Both commands are equivalent, because value of stopTypeTrailing constant equals 2 and value of stopModePercent constant equals 1, yet the first version is much more understandable.

There is also another reason to use pre-defined constants rather than hard-coded numbers in the code. If for any reason the internal value of given constant changes due to development needs – all formulas using constants will continue to work properly (because new version would interpret them properly), while hard-coded numbers may change the code execution. For example – inWeekly and inMonthly constants have changed with introduction of N*inDaily timeframes, however if we always used:
TimeFrameSet( in Weekly ); in the code, then such internal change does not really affect our formulas at all.

There is one more example worth discussing – in the documentation of PlotShapes function we can find:

PlotClose"Price"colorBlackstyleCandle );
//
Buy CrossMACD(), Signal() );
Sell CrossSignal(), MACD() );
//
shape Buy shapeUpArrow Sell shapeDownArrow;
//
PlotShapesshapeIIfBuycolorGreencolorRed ), 0IIfBuyLowHigh ) )

So – what does the multiplication mean in the above context? If we remember that constants are in fact just numbers, and boolean True in AFL has numeric value of 1, while boolean False has numeric value of 0, then:

– if Buy is True (equals 1) and Sell is False (equals 0), then the result of such calculation will be

shape = 1 * shapeUpArrow + 0 * shapeDownArrow = shapeUpArrow

– if Buy is False (equals 0) and Sell is True (equals 1), then the result of such calculation will be:

shape = 0 * shapeUpArrow + 1 * shapeDownArrow = shapeDownArrow

The above approach is kind of shortcut that saves using conditional statements. It would work correctly only if Buy and Sell signals never occur on the same bar and only if we assign just 0 or 1 (False / True) to Buy and Sell arrays. Otherwise the result of calculations would be different. The internal value of shapeUpArrow is 1 and ShapeDownArrow is 2, so in situation, where both Buy and Sell signals were true, we would get

shape = 1 * shapeUpArrow + 1 * shapeDownArrow = shapeUpArrow + shapeDownArrow = 1 + 2 = 3

So – we would then pass number 3 to PlotShapes function and this is neither shapeUpArrow nor ShapeDownArrow, but a different shape. That is why in general case it is better to use conditional function IIf, like shown below:

shape IIfBuyshapeUpArrowIIfSellshapeDownArrowshapeNone ) )

This way we are always sure that returned value will be shapeUpArrow or shapeDownArrow or shapeNone.

How to setup automatic periodic scans & explorations

One of the most powerful features of AmiBroker is the ability of screening even hundreds of symbols in real-time and monitor the occurrence of trading signals, chart patterns and other market conditions we are looking for. This can be done in Analysis module with Scan or Exploration features.

The main difference between Scan and Exploration is that Exploration allows to customize the output shown in Analysis window (this is explained in details in the following tutorial chapter: http://www.amibroker.com/guide/h_exploration.html), while Scan performs search for at least one of Buy, Sell, Short, Cover signals and displays predefined set of columns. Both these features allow for continuous screening of the database in real-time conditions.

The following procedure shows how to configure basic scan formula and generate alerts when conditions coded in the formula are met. We assume that AmiBroker is already configured to receive real-time data from one of realtime data vendors – the list of recommended datasources is available here: http://www.amibroker.com/guide/h_quotes.html

We need to do the following:
– open Formula Editor window with Analysis->Formula Editor command from the menu
– in the editor window enter or paste the code below

// example trading signals defined here
Buy CrossMACD(), Signal() );
Sell CrossSignal(), MACD() );
//
// additional part of the formula which generates audio alerts when condition is detected
AlertIFBuy"SOUND C:\\Windows\\Media\\Ding.wav""Audio alert");
AlertIFSell"SOUND C:\\Windows\\Media\\Ding.wav""Audio alert")

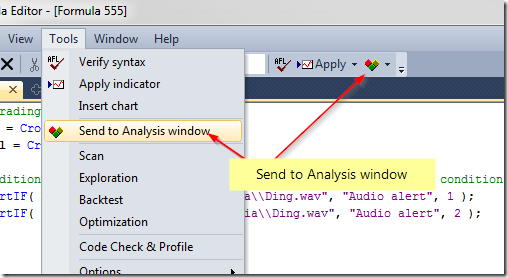
After entering the code use Tools->Send to Analysis as shown below:

Send to Analysis

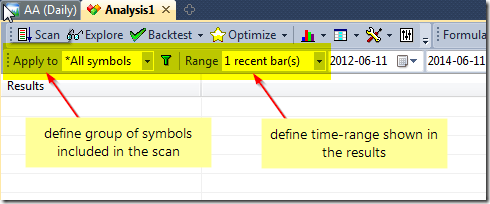
Then in the Analysis window select Apply To: All Symbols, Range: 1 Recent bar, this defines which symbols are included in the screening and what time-range will be shown in the results list.

Range setting

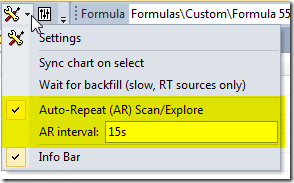
To enable continuous screening, mark Auto-repeat (AR) Scan/Explore option and enter the repeat interval. The interval can be specified in minutes or seconds (for example entering 10s means 10-seconds, while 5m means 5-minutes). The below example uses 15-second repeat interval:

Auto-repeat setting

NOTE: If that is the very first screening after launching the database and it may require filling the historical quotes, then it is also required to mark Wait for Backfill (applies to data sources, which support this feature, see: http://www.amibroker.com/guide/h_rtsource.html for more details).

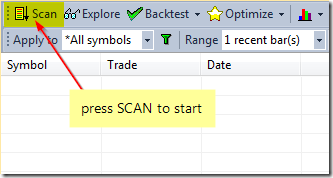
Now press Scan button to initiate the screening process:

Scan

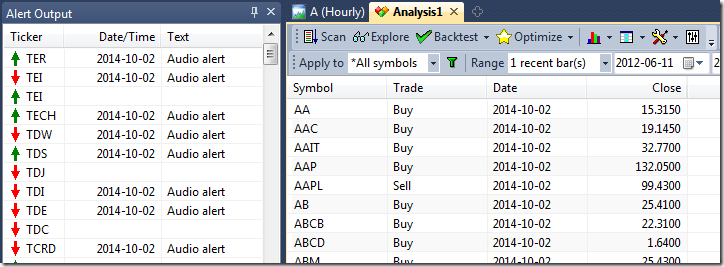
The results window will show the hits and generated alerts will also be logged in Alert Output window and the scan will be automatically repeated every 15 seconds in search for new signals.

Scan

More information about generating and configuration formula-based alerts is presented in this tutorial: http://www.amibroker.com/guide/h_alerts.html

How to restore accidentially deleted price chart

When working with chart windows it sometimes may happen that we mistakenly close the chart we meant to keep displayed. Here are some suggestions showing how to quickly restore our working setup.

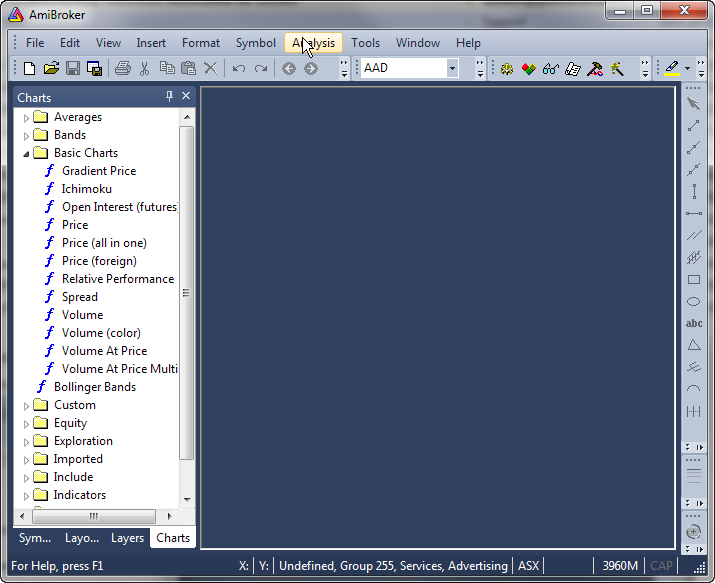
First situation happens when when we closed all chart windows and AmiBroker shows just an empty application window, what looks like this:

Empty chart space

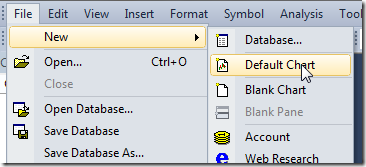
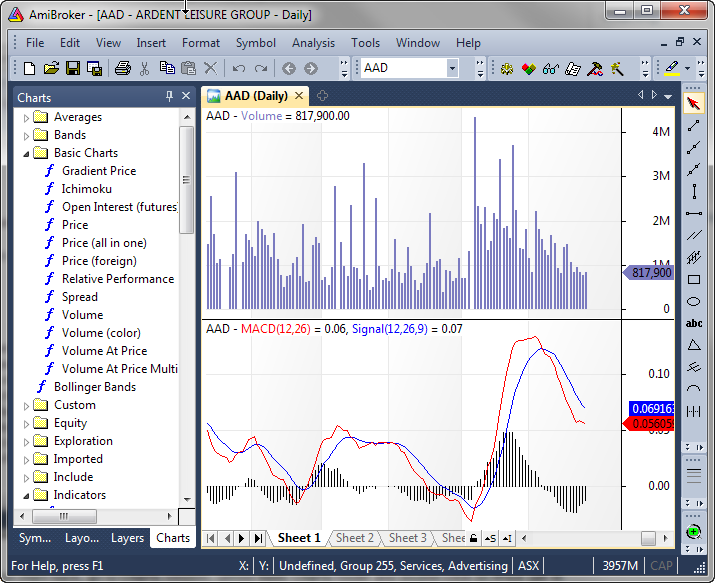
In such situation the best way is to use File–>New–>Default Chart menu command, as a result will display a new chart window, which contains charts stored in default template.

Re-open default chart

Second situation is when we closed just the Price chart pane, so only indicators would remain in the chart window, looking like this:

No price pane

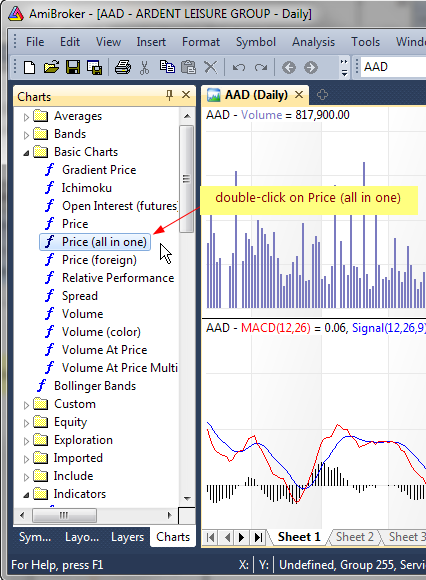
In order to bring the Price chart back, go to Charts window, unfold Basic Charts folder and double-click on Price (all in one) (if you want to get price chart with moving average and Bollinger bands overlays), or double-click Price (if you want to get price chart alone).

Insert price chart

It will be located at the bottom, below the other charts, but we can move it up to the top if we right-click on the chart, then choose Pane->Move Up from the context menu.

It is worth noting that AmiBroker allows to create multiple chart setups stored in Layouts, so if we have already created several layouts before, it is also possible to re-load one of the layouts from the Layouts window to restore the whole saved chart setup. This functionality is discussed in details in the following tutorial chapter: http://www.amibroker.com/guide/h_sheets.html

Third party software “black list”

From time to time users face bizarre problems that after hours/days of investigation turn to be caused by 3rd party softwares that modify normal operation of Windows OS and cause troubles. As most problems are caused by badly written antiviruses, we recommend using Microsoft Security Essentials that is known to be OS friendly, working fast and without issues.

Here is a list of 3rd party software that are known to cause problems:

1. Avast Antivirus – specifically it’s Autosandbox feature messes up with operating system and effectively disallows application to write data to the disk. Which means that any of your changes to the data, watch lists, drawings, etc, will not be saved unless you turn off Autosandbox or uninstall Avast. Avast has its “heuristics” all wrong. They use Autosandbox even on legitimate, Microsoft Authenticode digitally signed applications like AmiBroker. Solution: uninstall Avast and install Microsoft Security Essentials instead.

2. Comodo Internet security – the same story as above – their “Sandbox” is messing up with OS and blocks applications from vital activity such as saving files or accessing registry. Their “sandbox” causes files to be stored in wrong places and become inaccessible. Either turn off sandbox or uninstall Comodo and install Microsoft Security Essentials instead.

3. Webroot Secure Anywhere – again it messes up with operating system causing problems with Windows Clipboard, preventing Edit->Paste from working in many applications including the new AFL editor. The solution is to go to Webroot Identity Protection settings and turn OFF Identity Shield. The issue affects many applications and is described in detail on their forum:
https://community.webroot.com/t5/Webroot-SecureAnywhere-Complete/Copy-Paste-Stops-Working-in-some-applications/td-p/21588/page/4

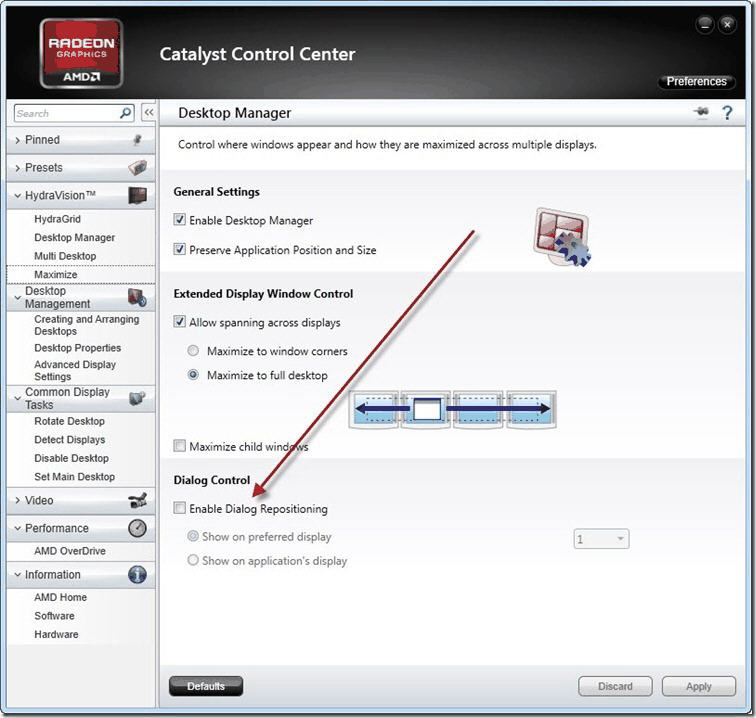
4. AMD Catalyst Software Suite, Desktop Desktop Manager – it may cause problems with saving window positions because it has a feature called “Dialog repositioning” that moves windows by itself somewhere else. AMD of course knows better where you want to have your windows. Solution: disable “Dialog repositioning” as shown below or turn off “Desktop Manager” feature. You may also uncheck “Preserve application position and size” box because AmiBroker remembers positions of all its windows by itself and does not need AMD’s help.

catalyst

For the list of recommended hardware and software see: http://www.amibroker.com/kb/2011/10/25/recommended-hardwaresoftware-for-amibroker/

How generate backtest statistics from a list of historical trades stored in a file

Apart from testing mechanical rules based on indicator readings, backtester can also be used to generate all statistics based on a list of pre-defined trades, list of our real trades from the past or a list of trades generated from another software.

To achieve that, first we need to create an input information for AmiBroker where it could read the trades from. A convenient way would be to use an input file in text format, which could store information about trades, including the type of transaction (buy or sell), dates and position sizes. A sample input file may look like this:
Symbol,Trade,Date,Price,Shares
AAME,Buy,2000-04-06,2.66,375.94
AAME,Buy,2000-04-10,2.66,378.922
AAPL,Buy,2000-04-27,31.23,32.0862
AAON,Buy,2000-04-06,3.19,313.48
ABAX,Buy,2000-04-26,7.67,132.101
AB,Buy,2000-04-25,20.23,50.0337
A,Buy,2000-04-27,84.66,11.8362
AAME,Buy,2000-05-10,2.6,373.627
ABCB,Buy,2000-05-11,6.08,159.406
A,Buy,2000-05-15,82.27,11.736
AAON,Buy,2000-05-18,3.84,246.242
AB,Buy,2000-05-15,20.84,46.3303
ABAX,Buy,2000-05-18,5.84,161.913
ABCB,Buy,2000-05-15,6.08,158.803
AAME,Buy,2000-05-19,2.6,363.763
AB,Buy,2000-06-05,22.78,43.3501
ABC,Buy,2000-05-18,4.49,210.595

We can read and backtest such input with the formula presented below. It is important to remember that this particular code can work with input files of identical format (columns in identical order, signals specified with exact Buy / Sell words, position sizes specified as shares). Changing the input format would also require to update the formula to match the input.

Path to the file is specified in the very first line (note that double backslashes need to be used).

The formula reads the file line by line, then on a bar with matching date/time it generates a new Buy or Sell signal that is then combined with existing signals (coming from other bars).

file "C:\\TEMP\\trades.csv"// change this to real location of your data file
dt DateTime();
//
// Initialize variables
Buy Sell possize 0;
//
fh fopenfile"r" );
//
if( fh )
 {
     while( ! 
feoffh ) )
     {
         
line fgetsfh );
         
// get the ticker symbol from the file
         
sym StrExtractline);
         
// if ticker matches current symbol
         
if ( Name() == sym )
         {
             
// extract data from line of text
             
trade StrExtractline);
             
trade_datetime StrToDateTimeStrExtractline) );
             
price StrToNumStrExtractline) );
             
shares StrToNumStrExtractline) );
             
//
             
if ( trade == "Buy" )
             {
                 
newbuy dt == trade_datetime;
                 
Buy Buy OR newbuy// combine previous buy signals with new
                 
BuyPrice IIfnewbuypriceBuyPrice );
                 
possize IIfnewbuysharespossize );
             }
             
//
             
if ( trade == "Sell" )
             {
                 
newsell dt == trade_datetime;
                 
Sell Sell OR newsell// combine previous sell signals with new
                 
SellPrice IIfnewsellpriceSellPrice );
             }
         }
     }
     
//
     
fclosefh );
 }
 else
 {
     
Error"ERROR: file can not be open" );
 }
//
SetPositionSizepossizespsShares )

Debugging techniques – Part 1 – Exploration

From time to time people send us their formulas asking what happens in their own code. Or they do not know why given trade is taken or not. These questions are usually caused by the fact that people lack the insight what is happening inside and what values values their variables hold.

The first general-purpose debugging technique is using Exploration.

You need to add several AddColumn statements and run your code as Exploration, so you can actually see the values of all variables. This will reveal whenever you really have values that you expect and would make it easier for you to understand what is happening inside your code.

In simplest form add this code to your system formula:

Filter 1// show all bars
AddColumnBuy"Buy" )

and it will show you if you are getting expected values in Buy array. You can use the same technique to track the content of any variable. Add as many columns as you want. You would be surprised how much insight into your own code you will get.

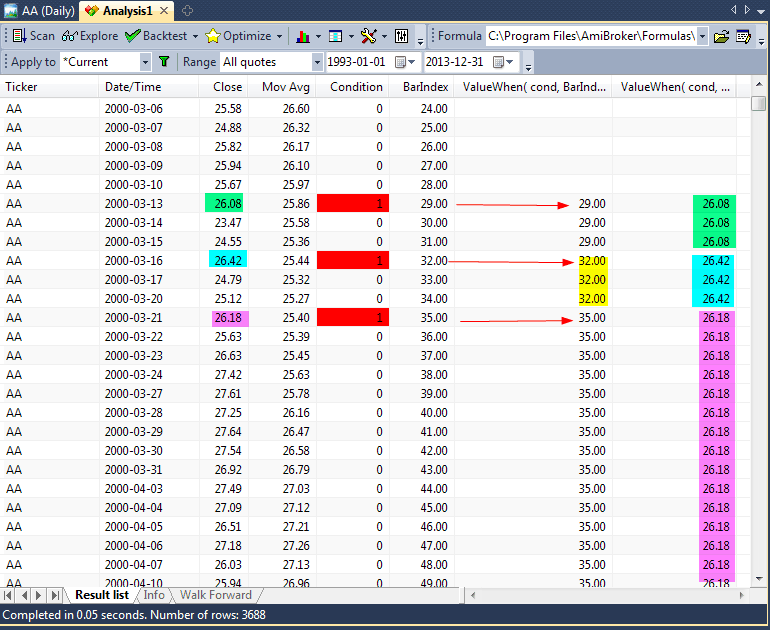
You can use Exploration to learn how particular function works, for example, if you don’t understand how ValueWhen works, you can display its results this way:

Filter 1// show all bars
//
MAC10 );
cond CrossC);
bi BarIndex();
//
AddColumnC"Close" );
AddColumnm"Mov Avg" );
AddColumncond"Condition");
AddColumnbi"BarIndex" );
AddColumnValueWhencondbi ), "ValueWhen( cond, BarIndex() )" );
AddColumnValueWhencondClose), "ValueWhen( cond, Close )" )

If you run above code you will clearly see how ValueWhen picks the value when condition is true and “holds” it for all other bars (when condition is false).

Debug using Exploration

Once you get this level of insight into your code you will be better equipped to fix any errors.
Exploration is number one choice in getting detailed view on what is happening inside your code.

For more information about Exploration see http://www.amibroker.com/guide/h_exploration.html

How to create your own code snippet

AmiBroker 5.84 (released today) offers users an easy way to create their own code snippets. Code snippet is a small piece of re-usable AFL code. AmiBroker comes with lots of pre-defined snippets. You can learn more about built-in snippets here.

But now you can add your own! And it is fairly easy using new Code Snippet window. Code Snippets window is available in new AFL editor (in floating frame mode). It can be shown/hidden using Window menu.

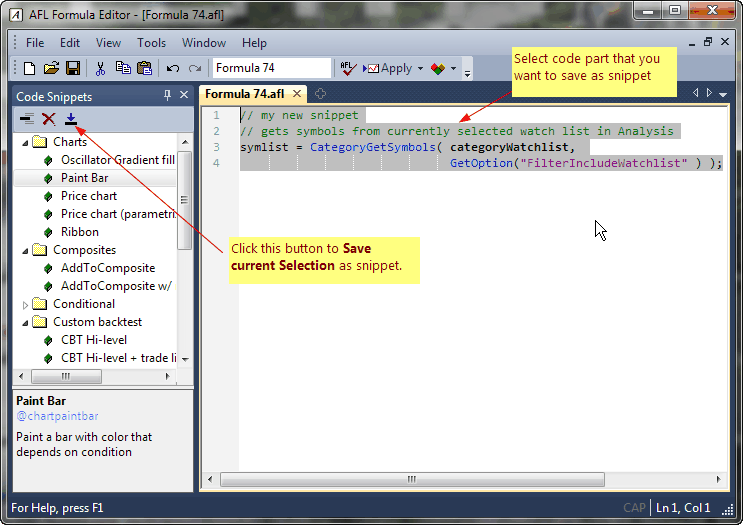
To create your own snippet, do the following:

  1. type the code you want
  2. select (mark) the code you want to place in a snippet
  3. press Save selection as snippet button in the Code Snippets window

Code Snippets 1

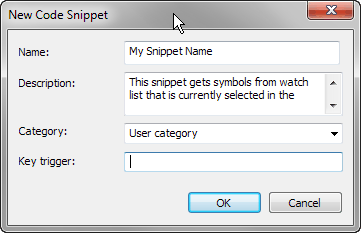
If you do the steps above the following dialog will appear:

Code Snippets 2

Now you need to enter the Name of the snippet, the Description and Category. Category can be selected from already existing items (using drop down box), or new category name can be typed in the category field. Key trigger field is optional and contains snippet auto-complete trigger (to be implemented later). Once you enter all fields and press OK, your new snippet will appear in the list.

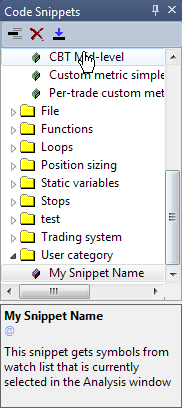
Code Snippets 3

From then on you can use your own snippet the same way as existing snippets. Perhaps most convenient method is using drag-drop from the list to AFL editor.

As you may have noticed user-defined snippets are marked with red color box in the Code Snippets list. Only user-defined snippets can be overwritten and/or deleted. To overwrite existing user-defined snippet, simply follow the steps above and give existing name. AmiBroker will ask then if you want to overwrite existing snippet. To delete a snippet, select the snippet you want to delete from the list and press Delete (X) button in the Code Snippet window.

Closing trades in delisted symbols

When we perform historical tests on databases that contain delisted symbols – we may encounter a situation, where there are open positions in those tickers remaining till the very end of the backtest, distorting the results (as these open positions will reduce remaining maximum open positions limit for the other symbols).

Here is an easy technique which allows to force closing positions in those symbols on the very last bar traded for given symbol. The code below just adds an additional Sell signal on the last available bar in the database for this symbol:

bi BarIndex();
exitLastBar bi == LastValuebi );
Sell /*your regular sell rules*/ OR exitLastBar

If we are using 1-bar trade delays in our backtesting settings, then the exit signal would need to be triggered one bar in advance (so the delayed signal could still be traded on the last bar) and the code would look like this:

SetTradeDelays(1,1,1,1);
bi BarIndex();
exitLastBar bi == LastValuebi );
Sell /*your regular sell rules*/ OR exitLastBar

There is also a dedicated field in Symbol->Information window which allows to store the delisting date directly in the database. AmiBroker allows to read that field from AFL code using GetFnData() function. If we have this field populated for delisted symbols for our symbols, then the code forcing exits on delisting date would be:

exitLastBar datetime() >= GetFnData("DelistingDate");
Sell /*your regular sell rules*/ OR exitLastBar

What is important, this approach would work also, when Pad and Align to reference symbol feature is used in Analysis window settings.

In order to populate Delisting Date field in the database, we can enter the dates manually through Symbol->Information window or use ASCII importer to import the information from the input text files. More details about ASCII importing can be found at:
http://www.amibroker.com/guide/d_ascii.html

How to import huge ASCII files quickly

From time to time we are asked how to import large text (ASCII) files quickly. Normally speed is non-issue for ASCII import as it is blazing fast. That kind of question typically comes from person who wants to import hundreds of megabytes of data.

ASCII importer is optimized for adding new data to the existing database, so the most efficient operation is adding current quote (the newest one).

If you want to import huge amount of data in ASCII format in most efficient manner you need to make sure that the file you are importing is sorted

  1. in ascending symbol order (so “AAPL” before “INTC”), and within symbol
  2. in ascending chronological order (so oldest records first, newest records last)

In SQL query talk it would be “ORDER BY Symbol ASC, Date ASC”.

Doing so ensures that no sorting is required during import and symbol shuffling is reduced to minimum, so in-memory cache is used most efficiently.

If your file is not ordered or ordered in reverse then it takes long to import because AB must shuffle data. In worst case scenario (newest records first), every data insert involves sorting which makes it a killer. The difference can be hours vs seconds on properly sorted file.

Can I encrypt my formula so no-one can decipher it?

Currently the only way to protect your code from other peoples’ eyes is to translate part of the formula (such as few functions) or entire formula to C/C++ language and compile as AFL plugin DLL. Doing so requires some C/C++ programming knowledge, a C/C++ compiler (free Visual Studio Express or GNU tools can be used) and AmiBroker Development Kit (ADK).

ADK contains instructions how to write your own AFL plugin along with code samples that are ready-to-compile. Some C/C++ knowledge is required though.

ADK is freely downloadable from
http://www.amibroker.com/bin/ADK.exe (self-extracing exe)
or
http://www.amibroker.com/bin/ADK.zip (zip archive)

NOTE: ADK is not for the beginners. It is for programmers (i.e. for people who already wrote some C/C++ code in their life). We are working on providing alternative methods for non-programmers.

« Previous PageNext Page »