amibroker

HomeKnowledge Base

Troubleshooting procedure when backtest shows no trades

When we run backtest and get no results at all – there may be several reasons of such behaviour. The main potential causes are the following:

  1. our system does not generate any entry signals within the tested range
  2. our settings do not allow the backtester to take any trades

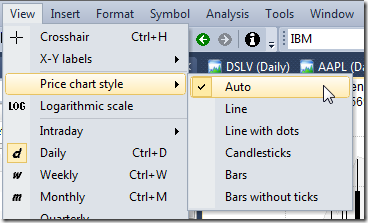
To verify if we are getting any signals – the first thing to do is to run a Scan. This allows us to check if we are getting any Buy or Short signals at all. If there are none, then we need to check the formula and make sure that data interval we are working on are correct (in Periodicity in Analysis->Settings->General).

If Scan works fine and returns trading signals, but backtester still does not produce any output, it usually means that the settings are wrong, i.e. the constraints set in the settings prevent trades from being opened mainly because requested position size is too big or too small.

To check what is going on, it is best to switch Report mode to Detailed log and re-run backtest.

Report - Detailed log

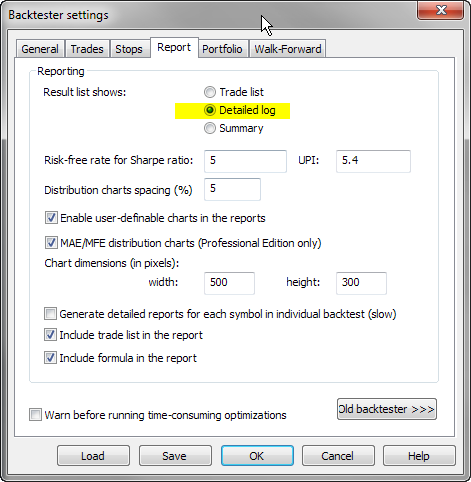
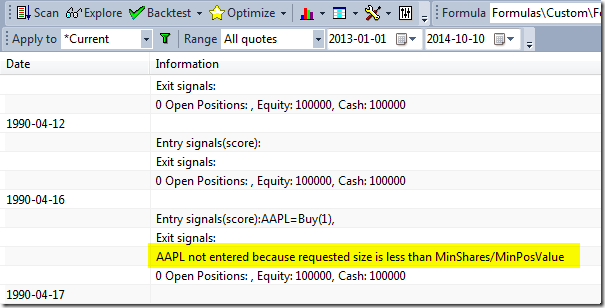
Once you run backtest in Detailed Log mode you will be able to find out exact reasons why trades can not be opened for each and every bar:

Detailed log output

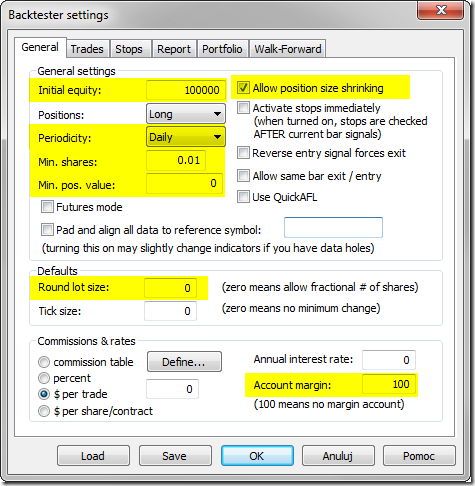
Using the following settings may be helpful to minimize chances of not entering trades because of various constraints:

In Analysis->Settings, General tab:

  1. check if Initial Equity is high enough
  2. set Periodicity to the appropriate interval
  3. Allow position size shrinking – turn it On
  4. Round Lot Size – set it to 0
  5. in Min. Shares box enter 0.01
  6. in Min. pos. value enter 0
  7. Account Margin – set it to 100

Settings - General

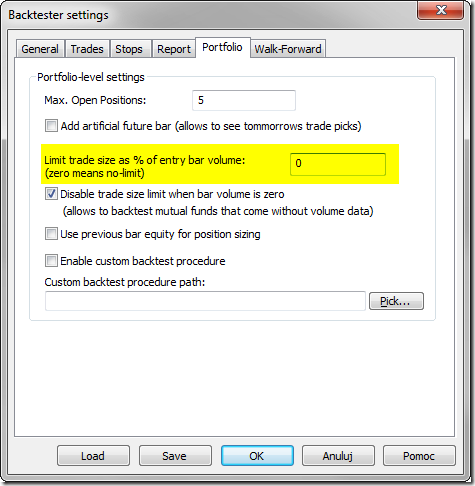
in Portfolio tab, enter 0 in Limit trade size as % of entry bar volume box.

Settings - Portfolio

How to adjust the number of blank bars in right margin

The default number of bars shown in the right-hand side of the chart area is defined in Tools->Preferences->Charting:

Blank bars

It is also possible to extend the blank bars area manually. Pressing END key on the keyboard will add 10 extra bars with each keystroke. Pressing HOME will reset the blank bars area back to default value from Preferences.

Number of bank bars can also be controlled using SetChartOptions() function from the code.

SetChartOptions00chartGridMiddle00100 );
PlotClose"Close"colorDefaultstyleBar )

Detailed documentation of SetChartOptions function is available in the manual:
http://www.amibroker.com/f?SetChartOptions

Indicators based on user values rather than standard OHLC prices

Sometimes we may want to calculate indicators based not only on standard OHLC prices but on some other user-definable values. Some functions like RSI or CSI have additional versions (RSIa, CCIa respectively) that accept custom input array. In this case it is very easy to calculate the indicator based on user defined value. For example RSI from average of High and Low prices could be written as follows:

customArray = ( High Low ) / 2;

PlotRSIacustomArray14 ), "RSI from (H+L)/2"colorRed )

But many of the built-in indicators available in AFL as functions refer indirectly to standard OHLC arrays and their parameters do not offer array argument as one of inputs.

Fortunatelly there is an easy way to provide custom array as input for any other built-in functions. For this purpose, it is enough to override OHLC arrays (or just Close if the indicator only uses Close as input) within the code before calling given function and assign our custom array. As a simple example, let us consider calculating MACD indicator out of average of High and Low prices as input.

procedure SaveRestorePricesDoSave )
{
  global 
SaveOSaveHSaveLSaveCSaveV;

  if( 
DoSave )
  {
     
SaveO Open;
     
SaveH High;
     
SaveL Low;
     
SaveC Close;
     
SaveV Volume;
  }
  else
  {
    
Open SaveO;
    
High SaveH;
    
Low SaveL;
    
Close SaveC;
    
Volume SaveV;
  }
}

// save OHLCV arrays
SaveRestorePricesTrue );

// calculate our array
customArray = ( High Low ) / 2;

// override built-in array(s)
Close customArray;

// calculate our function, MACD and Signal in this case
PlotMACD1226 ), "MACD"colorRed );
PlotSignal1226), "Signal"colorBlue );

// restore OHLCV arrays
SaveRestorePricesFalse )

The code first calculates the custom array (we use just use average of High and Low prices in this example, but of course the calculations may be more complex), then assigns the result of these calculations to Close overriding the regular values stored in close array. Then – when we call MACD() function which uses Close as input – it will be based on the modified values.

The above operations do not affect the underlying database at all – the prices are overridden only for the purpose of calculation of this particular formula and other charts / indicators are not affected at all.

How to sync a chart with the Analysis window

When we want to sync a chart with the selected symbol in the Analysis results list, it is enough just to double-click on the particular line in the list and AmiBroker will automatically switch the selected symbol and interval to match the Analysis window.

Sync by double click

Additionally, when we browse through Scan or Backtest results, double-clicking would be an equivalent of Show arrows for all raw signals option from the context menu and would display trading arrows in the chart to match the signals generated by the formula.

If we find that double-clicking is too much work, it is possible to mark Sync chart on select option in Analysis window settings menu:

Sync chart on select

and then single click to select a chart is enough to sync the symbol in the chart. This also allows to use keyboard (up/down cursor keys) to change the selection and sync automatically.

When we have more than one chart window displayed, then Analysis window will always sync the last opened chart window.

If we want to sync multiple chart windows we can use Symbol Link feature. Once multiple windows have the same “Symbol Link” color selected, browsing through the results list in Analysis automatically will automatically sync all linked chart windows (e.g. for the purpose of showing different intervals in each of the charts).

Linking

More information about chart link functionality is available in tutorials at:
http://www.amibroker.com/guide/h_sheets.html. See also video tutorial showing how to use symbol linking: http://www.amibroker.com/video/FloatAndLink.html

Using per-symbol parameter values in charts

Parameter values in AmiBroker are stored separately for each ChartID. A ChartID is a number that uniquely identifies chart. This makes it possible that parameters having same name can hold different values when they are used in different charts (different ChartIDs). This also allows to share parameters if two panes use same ChartID. (A detailed explanation can be found here: http://www.amibroker.com/kb/2014/10/06/relationship-between-chart-panes/ )

For this reason, if we want to have separate chart parameters for each symbol, we need to set up separate chart for every symbol. To do so, follow these steps:

  1. create several new chart windows using File->New->Blank Chart (or choosing New Blank Chart from the menu under + button in MDI tabs area)
    New Blank Chart

  2. drag Price( all in one) formula or any other indicators onto each of the newly opened windows
    Drag-drop chart

  3. select different active symbol for every chart
  4. define parameters individually and save the whole layout in the Layouts window

As a result – we have a setup of several chart windows, where we can quickly access given symbol showing chart with its separately stored parameters.

MDI Charts

There is also a way to handle the chart parameter values directly from the AFL formula, which would detect the active symbol and set the parameter values accordingly. Here is an example of such implementation using switch statement:
http://www.amibroker.com/guide/keyword/switch.html

To display this chart, open the Formula Editor, enter the following code and then press Apply Indicator button.

// detect the active symbol and store in n variable
Name();

// set parameter values based on the symbol name
switch ( )
{
// values for MSFT symbol
case "MSFT":
    
MA1periods 10;
    
MA2periods 21;
    break;

// values for IBM and NVDA
case "IBM":
case 
"NVDA":
    
MA1periods 30;
    
MA2periods 40;
    break;

// values for other tickers
default:
    
MA1periods 50;
    
MA2periods 100;
    break;
}

PlotClose"C"colorDefaultstyleBar );

PlotMACloseMA1periods ) , "MA(" MA1Periods ")" colorRed );
PlotMACloseMA2periods ) , "MA(" MA2Periods ")"colorBlue )

This way we can handle all individual parameter values within a single chart pane.

How to create toolbar button for custom interval

IMPORTANT NOTE: Before you add toolbar buttons for dozens of intervals please note that any interval can be picked from Interval Selector combo-box. If given interval is not present, you can just type it: 7m means 7-minute, 3h means 3-hour, 2D is 2-day), as shown below:

Custom time intervals

In order to add custom time-interval buttons onto the toolbar we first need to define our custom intervals in Tools->Preferences->Intraday:

Custom time intervals

Now, in order to customize the toolbar go to Tools-> Customize menu. That switches AmiBroker into special customization mode.

Now, while keeping the customize dialog open, we can just go to View->Intraday menu and pick the items we need, then start dragging it with the mouse cursor to the toolbar of our choice.

Custom time intervals

If we keep holding down CTRL key while dragging the items, a copy will be created on the toolbar, so the items will not be removed from the original menu.

Custom time intervals

It is also possible to replace the default text-description with a button image. This is further explained in the manual:
http://www.amibroker.com/guide/h_customizeui.html

How to backup AmiBroker configuration

By default AmiBroker stores all its files and databases inside AmiBroker installation folder. Standard AmiBroker installation path is:
C:\Program Files\AmiBroker (32-bit program installed on 32-bit Windows or 64-bit program installed on 64-bit Windows)
or
C:\Program Files (x86)\AmiBroker (32-bit program installed in 64-bit Windows)

The best way to secure our setup is to make a copy of the entire AmiBroker folder with all its subfolders. No special tools are required for this operation – the entire directory can be copied into new location using Windows Explorer.

That allows to quickly restore the entire working setup if anything goes wrong just by copying the whole contents of AmiBroker folder back.

We need to remember that if we store our databases in locations outside AmiBroker folder, then we would need to backup the database folders as well. The same applies when we use custom location for Formula tree root path defined in Tools->Preferences->AFL. If the formulas are stored outside AmiBroker folder, then they would need to be copied as well.

For the purpose of handing individual elements of the configuration – the list of AmiBroker important files is available in the manual:
http://www.amibroker.com/guide/x_files.html

In particular, in order to backup / restore layouts we need to copy the entire Formulas folder, broker.newcharts file and the layout files you have in the other machine. This is because layouts refer to certain charts recognized by their chart ID number. So – all elements have to be present:
.awl files (holding layouts calling certain charts recognized by their ID)
broker.newcharts file which contains list of charts (their IDs) and their corresponding formula files
– contents of Formulas folder – to have formula referenced by certain charts

It is also good idea to have a backup of your entire disk. Such disk-imaging programs allow to restore entire computer setup in a matter of minutes without need to re-install Windows and all the programs. Two popular disk imaging programs are: Macrium Reflect or Acronis True Image and they allow backups to be done even while you are working.

For advanced users:

Certain settings and customizations of user interface are stored in the system registry. AmiBroker uses keys under:

HKEY_CURRENT_USER\Software\TJP\Broker\

Using Regedit tool allows to backup and restore registry keys too. To export AmiBroker registry key follow these steps:

  1. Click Start, type regedit.exe in the search box, and then press Enter
  2. Find HKEY_CURRENT_USER\Software\TJP\Broker\
  3. Right-click on the selected key and choose EXPORT from the context menu and save the file.

The following Microsoft KB article explains the procedure:
http://support2.microsoft.com/kb/322756

How to correct forward looking timestamps

Some platforms, like Tradestation, use “future looking” timestamps in their data so for example 5 minute bar covering market activity from 9:30:00 till 9:34:59 is stamped with 9:35:00 (future time – see Tradestation manual explaining their timestamps) so their data have a kind of future offset.

AmiBroker, on the other hand, uses and expects natural timestamping, in which data from 9:30 are marked with 9:30 timestamp, so data from 9:30:00 until 9.34:59 belong to 9:30 5-minute bar.

If you want to use future-timestamped data in AmiBroker you need to remove the offset.

To do so, you need to shift the timestamps back by the amount equal to the base data interval during import process. In case of 5-minute bars, you need to shift data by -5 minutes.

To shift the data during import you can use $TIMESHIFT command of ASCII importer, see http://www.amibroker.com/guide/d_ascii.html

$TIMESHIFT offset_in_hours

the offset_in_hours parameter defines the time in hours that should be added to imported timestamps. You can use negative and fractional values too. Each minute is 1/60 of hour so shifting back by 1-minute would be -0.01666667.

If you are using ASCII Importer Wizard, and want to import 5-minute data with future looking timestamps, you can simply type the following in the “Additional commands” box of ASCII Importer Wizard.

$TIMESHIFT -0.08333333333333

-0.08333333 is a result of dividing 5 by 60 (number of minutes in an hour)

Please find out what time-stamping method is used by your data provider because it is important to know that to get your higher-interval charts right.

How to exclude top ranked symbol(s) in rotational backtest

Rotational trading is based on scoring and ranking of multiple symbols based on user-defined criteria. For each symbol a user-definable “score” is assigned on bar by bar basis. Then, each bar, symbols are sorted according to that score and N top ranked symbols are bought, while existing positions that don’t appear in top N rank are closed.

Sometimes however, we may want to exclude the highest ranking symbol (or a couple of them) from trading. The code below shows how to do that using custom backtester.

ExcludeTopN 1// how many top positions to exclude
SetCustomBacktestProc("");

if ( 
Status"action" ) == actionPortfolio )
{
    
bo GetBacktesterObject();
    
bo.PreProcess();

    for ( 
bar 0bar BarCountbar++ )
    {
        
Cnt 0;
        for ( 
sig bo.GetFirstSignalbar ); sigsig bo.GetNextSignalbar ) )
        {
            if ( 
Cnt ExcludeTopN )
                
sig.Price = -1// exclude

            
Cnt++;
        }

        
bo.ProcessTradeSignalsbar );
    }

    
bo.PostProcess();
}

EnableRotationalTradingTrue );

SetOption"MaxOpenPositions");
SetOption"WorstRankHeld"10 );
SetPositionSize20spsPercentOfEquity );
PositionScore RSI14 )

The code is pretty straightforward mid-level custom backtest loop but it uses one trick – setting signal price to -1 tells AmiBroker to exclude given signal from further processing. Note also that signals retrieved by GetFirstSignal / GetNextSignal are already sorted, so the highest ranked signal appears first in the list.

How to force Line chart style for specific symbols (like mutual funds)

There is an easy way to avoid switching the price chart style back and forth if we want e.g. to display a candlestick chart for our stock symbols, but a line chart for just a subset of tickers in our database (e.g. mutual funds).

To achieve that – we need to set Continuous Quotations option to No in Symbol->Information window for the symbols that have only one price fixing per day (only close price available).

Continuous Quotations

Then – if we choose View->Price Chart Style to Auto – the chart will automatically use Line style for all symbols that have Continuous quotations option set to No. Other symbols will still use Candlesticks chart style.

Automatic style

« Previous PageNext Page »